Guessing is easy, but guessing cannot be scaled. I have spent the better part of my career fixing hiring problems that started with “gut feel.” Every single time, the answer was the same, measure what matters, turn patterns into insight, and let the numbers guide the next move.
I will break down the recruitment metrics I tend to rely on when making recruiting decisions. The models I use will turn raw data into real world decisions that can payoff in troves. Copy, tweak or roll out these data driven solutions to your team and let me know how it worked for you.
Why I Obsess Over Recruitment Metrics
Metrics are not dashboard decorations; they are directional signals. When I track the right data, I can:
- Spot bottlenecks before they stall your growth
- Surface quality issues in sourcing or selection
- Show that there is a ROI on tools, branding, and headcount
- Make sure that your team (Managers and Recruiters) are moving in the same direction
According to Future of Recruiting, a LinkedIn post from 2023, almost 70% of talent leaders express the importance of using good data to drive recruitment decisions but less than 40% think they are using it correctly. If you want influence, you need evidence. Simple as that.
The Five Core Metrics I Never Ignore
1. Time to Fill
What it is: Days from requisition approval to offer acceptance.
Why I care: Open seats drain productivity. According to SHRM, the average time to fill is thirty-six days (2022).
My quick fixes: Tight intake calls, pre-screen assessments, automated scheduling, and an ATS that shows the timeline in plain sight.
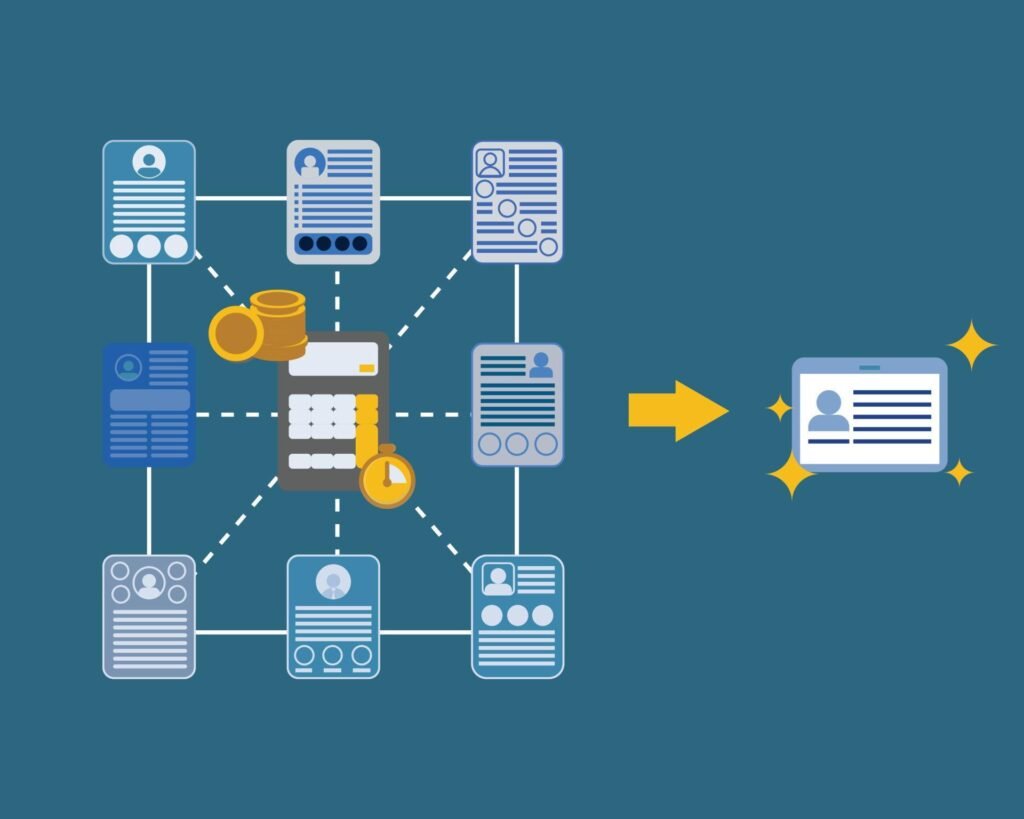
2. Cost per Hire
What it is: (Internal hiring spends + external hiring spends) divided by number of hires
Why I care: Leader’s fund what they can see. The article Recruiting Metrics Benchmarks andTrends believes the average cost per hire is between $3,000 and $5,000. Knowing the number helps will help you defend or trim the spend.
My quick fixes: Bundle job ads, beef up referral rewards, and lean on one scalable ATS.
3. Quality of Hire
What it is: The value that a new employee brings to the organization and how well they perform while integrating into the company’s culture.
Why I care: Speed without staying power is wasted effort. According to Gallup’s State of the Global Workplace Report tracking this metric can lead to a 20% bump in retention.
How I track it: Check-ins at 30, 60, and 90 days and manager ratings on the employee
4. Offer Acceptance Rate
What it is: Accepted offers divided by total offers.
Why I care: Try to get your acceptance rate to at least 80% because low acceptance screams brand or comp trouble.
My quick fixes: Set salary expectations clearly, shine light on the total rewards offered, and streamline the approval process.
5. Source of Hire
What it is: The channel that landed each hire (LinkedIn, referrals, job boards, and so on).
Why I care: Money flows to what works. Knowing where my best people originate lets me double down on high-yield sources.
Advanced Metrics for TA Leadership
- Recruiter Efficiency: Hires per recruiter per month. Set a goal on how many hires each recruiter should be producing based on the number of jobs that are needed and the difficulty of the skillset. There is no need to have a recruiter hire 10 CFOs when the roles is difficult to fill and only one is needed.
- Pipeline Conversion Rates: Moving candidates in the pipeline can reveal leaks in the funnel.
- Candidate Experience Score: post-interview surveys that directly correlate with quality of hire.

How I Turn Recruitment Metrics into Repeatable Models
Collecting numbers is half the job. Making them talk is the other half. Here are the three models I use:
- Recruiting Funnel Model
Map each stage by sourcing, applying, screening, interviewing, offering, hiring. Measure conversion at every handoff. Find and fix the leaks. - Workforce Planning Model
Blend historical hiring trends, growth forecasts, and attrition data to predict headcount by team and location. This keeps TA and Finance on one roadmap. - TA Scorecard Model
Create a monthly scorecard including time to fill, cost per hire, acceptance rates, pipeline conversions, candidate experience. Share it with leadership and hiring managers. Trends beat snapshots every time.
Final Word
Start with measurement to increase hiring speed, create influence and build a strong reputation. Evidence wins every argument, especially in a talent acquisition strategy.
Check out our article on creating the best job requisition to jump start your recruitment metrics.
References
Gallup. (2021). State of the global workplace: 2021 report. https://www.gallup.com/workplace/349484/state-of-the-global-workplace-2021-report.aspx
Gartner. (2023). Recruiting metrics benchmarks and trends. https://www.gartner.com/en/human-resources/insights/recruiting-metrics
IBM Smarter Workforce Institute. (2021). The business case for candidate experience. https://www.ibm.com/downloads/cas/EXK4XKX8
LinkedIn. (2023). Future of recruiting: 2023 report. https://business.linkedin.com/talent-solutions/blog/trends-and-research/2023/future-of-recruiting-2023
Society for Human Resource Management. (2022). Talent acquisition benchmarking report. SHRM. https://www.shrm.org/hr-today/trends-and-forecasting/research-and-surveys/pages/talent-acquisition-benchmarking.aspx